Data Visualization and BI
Your data doesn't have to be boringThe Challenge
Every organization has data. Collecting the data was the easy part. Now what? How do you get the right data to the right people, without confusing or overwhelming them with irrelevancies? How do you make the data actionable?
Our Solution
OWCER can help you unlock your data and make it accessible to your users, in a controlled manner. Data visualizations can help:
- Save money by uncovering problems earlier
- Uncover opportunities to improve resource utilization, negating or postponing the need to acquire more resources
- Shift the organization from reactive to proactive actions
OWCER can help your organization use the data it already has in new ways and identify additional data collection options. OWCER employs many visualization techniques from simple charts to interactive business intelligence drill through applications to help your organization get the most out of its data.
See What You Haven’t Seen Before
OWCER can meet the most demanding data presentation challenges, from millions of data elements to custom, application-driven report visualizations. We specialize in displaying data in context such as geographically, temporally, or procedurally. You’ll get more value out of the data you already have, gain new insights, and discover what you didn’t know you didn’t know. 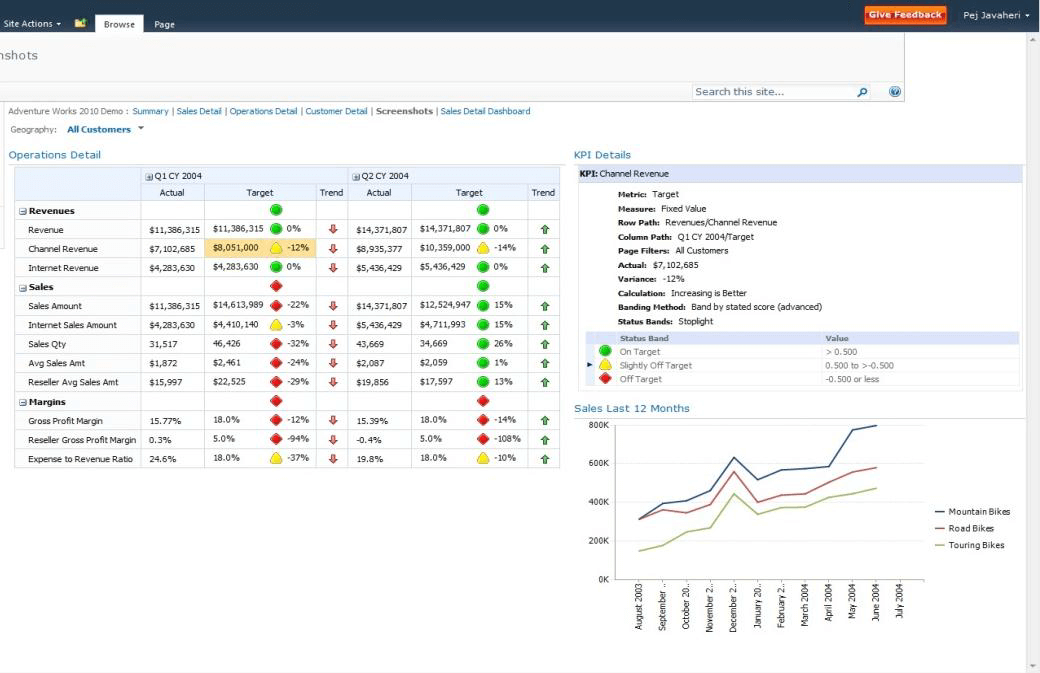
New Doesn’t Always Mean Better
Innovation can be cool and wonderful, but sometimes you need the tried and true to get the job done. This example of a traditional dashboard-style report displays a large amount of aggregated, actionable information that a reader can interpret very quickly. 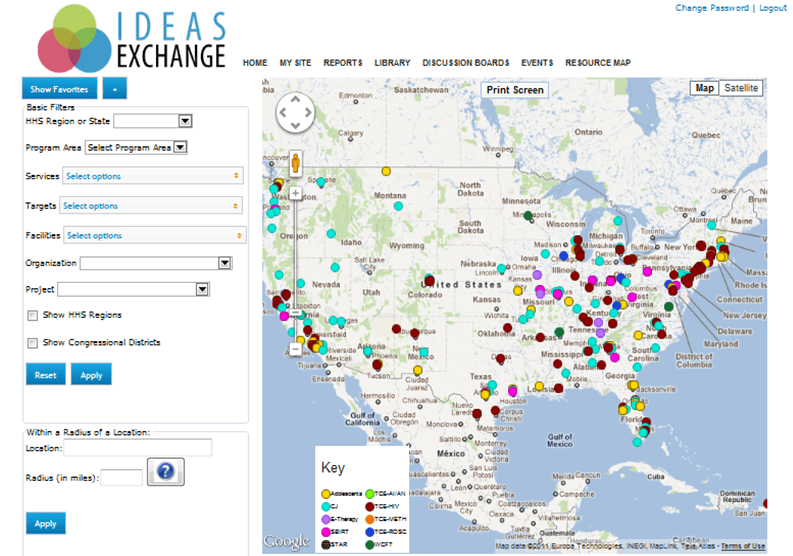
The Right Tools
OWCER specializes in designing and implementing the Microsoft reporting and business intelligence tools set. This allows OWCER to implement both enterprise-driven and end-user self-service reporting and business intelligence solutions at a fraction of the cost of traditional BI and reporting tools such as MicroStragey and Cognos. OWCER has expertise in the following reporting, BI, and integration tools:
- SQL Server Reporting Services
- SQL Analysis Services
- Excel Services
- Power Pivot
- Power View
- Performance Point
- Vision Graphics Services
- SharePoint KPIs